European Union

My many years of experience show that more and more companies apply various practices to combat water losses. I myself am the author of a multifaceted program to reduce these losses, consisting of 9 areas, which I successfully implement for my clients.
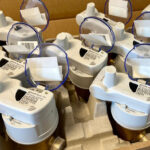
However, many of them want to start with “big” things – such as GIS, zoning or monitoring, forgetting that reducing apparent losses simply starts with … a water meter. Simply, but not simple, because if you want to optimize the selection of water meters in your company, you should realize that:
- Currently, there is no legal act in force that clearly states how to select water meters, and many companies replace the oversized water meter with a higher class – parameter R,
- the law only provides general conditions – for example, the size of a water meter is selected on the basis of the estimated volume flow, pressure and physical and chemical properties,
- there are no real calculation formulas, and those that function in practice – from the 1990s, overestimate the size of water meters,
- an oversized water meter not only costs more, it also usually fails to meter a certain amount of water for the water utility.
Is there a method in this madness?
Due to this ambiguity, many years ago I proposed a method called “statistical”, which was implemented by enterprises i Poland, among others in Bydgoszcz, Częstochowa, Gdańsk, Kołobrzeg, Łódź, Katowice, Rzeszów and Kraków.
It is based on the assumption that the water flow rate can be described by a function depending on the volume of water used, the number of premises, and the number of inhabitants served. Depending on the use of the facility, its functions and fire protection. we are able to provide q3 / qn and R of the optimal water meter for a given water connection and calculate water losses / additional income from the use of a new device.
Where should we start?
It is worth asking the question what is the total volume of water invoiced with water meters of various diameters. For selected water supply systems, we present a list of water meters depending on the data describing the water supply system. Sometimes it happens that 10% of water meters are responsible for over 50% of the company’s revenues – and this is where you have to start. In other enterprises, especially smaller ones, one should remember to use water meters DN 20 and q3 = 2.5 m3 / h, which will additionally generate 5-10% more income in the enterprise.
| City | A | B | C | D | E | F | G | |
| Number of residents | 32250 | 53000 | 79625 | 91000 | 119080 | 357650 | 1890000 | |
| Number of water connections | 3423 | 5634 | 20866 | 12803 | 9485 | 27542 | 99184 | |
| The length of the water supply network (km) | 135 | 150,4 | 490 | 349,8 | 250,4 | 742,03 | 4230 | |
| Number of water meters in pcs./% – DN diameters | 15 | 292 | 3320 | 13315 | 2396 | 1300 | 1056 | 0 |
| 15 | 8,53% | 58,93% | 63,81% | 18,71% | 13,71% | 3,83% | 0,00% | |
| 20 | 2764 | 1574 | 6451 | 9386 | 7000 | 17579 | 68722 | |
| 20 | 80,75% | 27,94% | 30,92% | 73,31% | 73,80% | 63,83% | 69,29% | |
| 15 & 20 in % | 89,28% | 86,87% | 94,73% | 92,03% | 87,51% | 67,66% | 69,29% | |
| 25 | 166 | 249 | 300 | 441 | 333 | 3819 | 9675 | |
| 25 | 4,85% | 4,42% | 1,44% | 3,44% | 3,51% | 13,87% | 9,75% | |
| 32 | 82 | 188 | 7 | 156 | 57 | 204 | 0 | |
| 32 | 2,40% | 3,34% | 0,03% | 1,22% | 0,60% | 0,74% | 0,00% | |
| 40 | 73 | 199 | 252 | 253 | 664 | 2864 | 10289 | |
| 40 | 2,13% | 3,53% | 1,21% | 1,98% | 7,00% | 10,40% | 10,37% | |
| 25-40 in % | 9,38% | 11,29% | 2,68% | 6,64% | 11,11% | 25,01% | 20,13% | |
| 50 | 28 | 71 | 267 | 124 | 71 | 1408 | 7392 | |
| 50 | 0,82% | 1,26% | 1,28% | 0,97% | 0,75% | 5,11% | 7,45% | |
| 65 | 0 | 0 | 206 | 12 | 3 | 34 | 0 | |
| 65 | 0,00% | 0,00% | 0,99% | 0,09% | 0,03% | 0,12% | 0,00% | |
| 80 | 13 | 23 | 62 | 30 | 45 | 416 | 2372 | |
| 80 | 0,38% | 0,41% | 0,30% | 0,23% | 0,47% | 1,51% | 2,39% | |
| 100 | 4 | 7 | 5 | 5 | 12 | 146 | 720 | |
| 100 | 0,12% | 0,12% | 0,02% | 0,04% | 0,13% | 0,53% | 0,73% | |
| 150 | 1 | 3 | 1 | 0 | 0 | 16 | 129 | |
| 150 | 0,03% | 0,05% | 0,00% | 0,00% | 0,00% | 0,06% | 0,06% | |
| 200 | 0 | 0 | 0 | 0 | 0 | 0 | 14 | |
| 200 | 0,00% | 0,00% | 0,00% | 0,00% | 0,00% | 0,00% | 0,01% | |
| 50-150 in % | 1,31% | 1,79% | 2,59% | 1,34% | 1,38% | 7,28% | 10,58% | |
| Total sum of watermeters DN 40-200 | 118 | 300 | 586 | 412 | 792 | 4834 | 20916 | |
| Amount of watermeters DN 40-150/km of water network | 0,87 | 1,99 | 1,19 | 1,18 | 3,16 | 6,51 | 4,94 | |
| % of watermeters DN 40-200 | 3,45% | 5,32% | 3,80% | 3,31% | 8,38% | 17,67% | 20,96% |
Fig. Structure of the size of water meters in selected cities in Poland (by Piotr Tuz)
Glass half empty or full?
I am pleased to see how reducing water losses is becoming more and more of a concern to Polish water and sewage companies, which are aware of the difficulties of implementing the new water directive. At industry conferences, many of you present your achievements and good practices in this field. However, I would change this perspective – by moving from awareness focused on loss and avoiding it towards awareness aimed at increasing the company’s revenues.
For one of our clients, together with our team, we optimized 16 500 water meters. Thanks to these changes, the additional annual profit on water sales will amount to PLN 2.88 million, which means a return on investment after 301 days.
Now the client is ready for the next steps to increase revenues – in his case it will be the implementation of a remote reading and monitoring system.
 Fig. A multi-faceted water loss reduction program adapted to the needs of the company (developed by Piotr Tuz)
WHERE IS OUR MONEY GOING?
I’ll end with the words of John C. Maxwell, a famous coach and author in the field of leadership: “Making a budget is telling your money where to go, instead of wondering where it went.” I wish you to point money in the right direction in your enterprises. If you need support in the field of reducing losses and at the same time increasing revenues, together with a team of experts we are at your disposal.
AUTHOR

p.tuz@wes.info.plThe article was based on a speech during the conference WATER.SEWAGE.SLUDGE 2022 of the Chamber of Commerce “Polish Waterworks”.
It has also been published:
on the website of the Chamber of Commerce “Polish Waterworks”- LINK
in the “Polish Waterworks” magazine No 22(76)/2022 – LINK